The question
Through 2024 and into 2025, EquipmentShare's direct Shopify revenue was sliding hard. Leadership wanted to know how bad it was, what was driving it, and what to do about it.
The first problem turned out to be the one beneath the question. Every report comparing
this year to last had a definitional issue: the order totals included branch transfers,
employee purchases, manual phone entries, and orders placed from @equipmentshare.com
email addresses. Those aren't real e-commerce customers. They're internal operations
showing up in the customer channel. Until that was fixed, every "revenue is down" or
"revenue is up" claim had a margin of error nobody could quantify.
Separate real customers from internal orders — at the data layer
We added a tenant-specific tag normalization pass to the DataMonster Shopify staging
model. For tenant 6, every order line gets tagged into a normalized _tag_list
column with one of two internal classifications:
| Tag pattern in source data | Normalized label |
|---|---|
es branch, es employee, es share, branch transfer, ...@equipmentshare.com email | shopify:es_internal |
manualentry, manual entry, manually processed, phone | shopify:es_manual |
Every downstream report — ours, yours, ad-hoc analyses, future BigQuery exports —
filters on this single _tag_list definition. When the rules change (new
operational tag, new internal email domain), the change lands in one place and
propagates everywhere.
This was iterative: the first pass shipped in Sep 2024 (tag normalization for tenant 6).
The full classification landed in Jun 2025 once we'd seen the failure modes — including
the phone tag, which we initially counted as external customer activity
until we realized it was the order-desk manual-entry channel.
datamonster/datamonster_dbt/models/shopify/stg__shopify__order_item.sql
(the _tag_list case block for tenant 6, lines 254–282). Platform-level
fix; every analysis after Jun 2025 inherits the correct definition.
Make YoY / MoM / TTM comparisons cheap to run
Once the order set was clean, we built a parameterized SQL toolkit so the same question ("how did this period compare to last year?") didn't require rewriting the query each time. The toolkit supports three comparison modes:
- Month-to-Month (YoY): Jan 2025 vs Jan 2024 — for spotting seasonal patterns and single-month anomalies.
- Trailing Twelve Months: rolling 12-month totals to smooth out seasonality and surface real trend changes.
- Custom range: any two date windows.
The toolkit covers six analysis axes — order-level comparison, price-tier breakdown,
SKU volume changes, SKU revenue impact, channel breakdown, and ad-hoc-date order-level
comparison. The Python runner (analysis.py) handles parameter substitution
and prints formatted output.
ad_hoc/equipmentshare/2025_diff/ — 6 parameterized
SQL files, analysis.py runner, ANALYSIS_METHODOLOGY.md. Reusable by any
analyst on any tenant by changing the _tenant_id filter.
Step 3 — diagnose the decline
With the toolkit in hand and the order set correctly filtered, we ran the comparison EquipmentShare actually needed: YTD 2024 vs YTD 2025 on real external Shopify Direct customers.
Orders down 15%, revenue down 41%, AOV down 30%. That's not a marketing-spend story or a price-elasticity story alone — those numbers say the high-value orders specifically collapsed. SKU-level revenue impact showed a small set of discontinued and stocked-out parts driving most of the loss.
We also saw — and this is the finding that changed the engagement's direction —
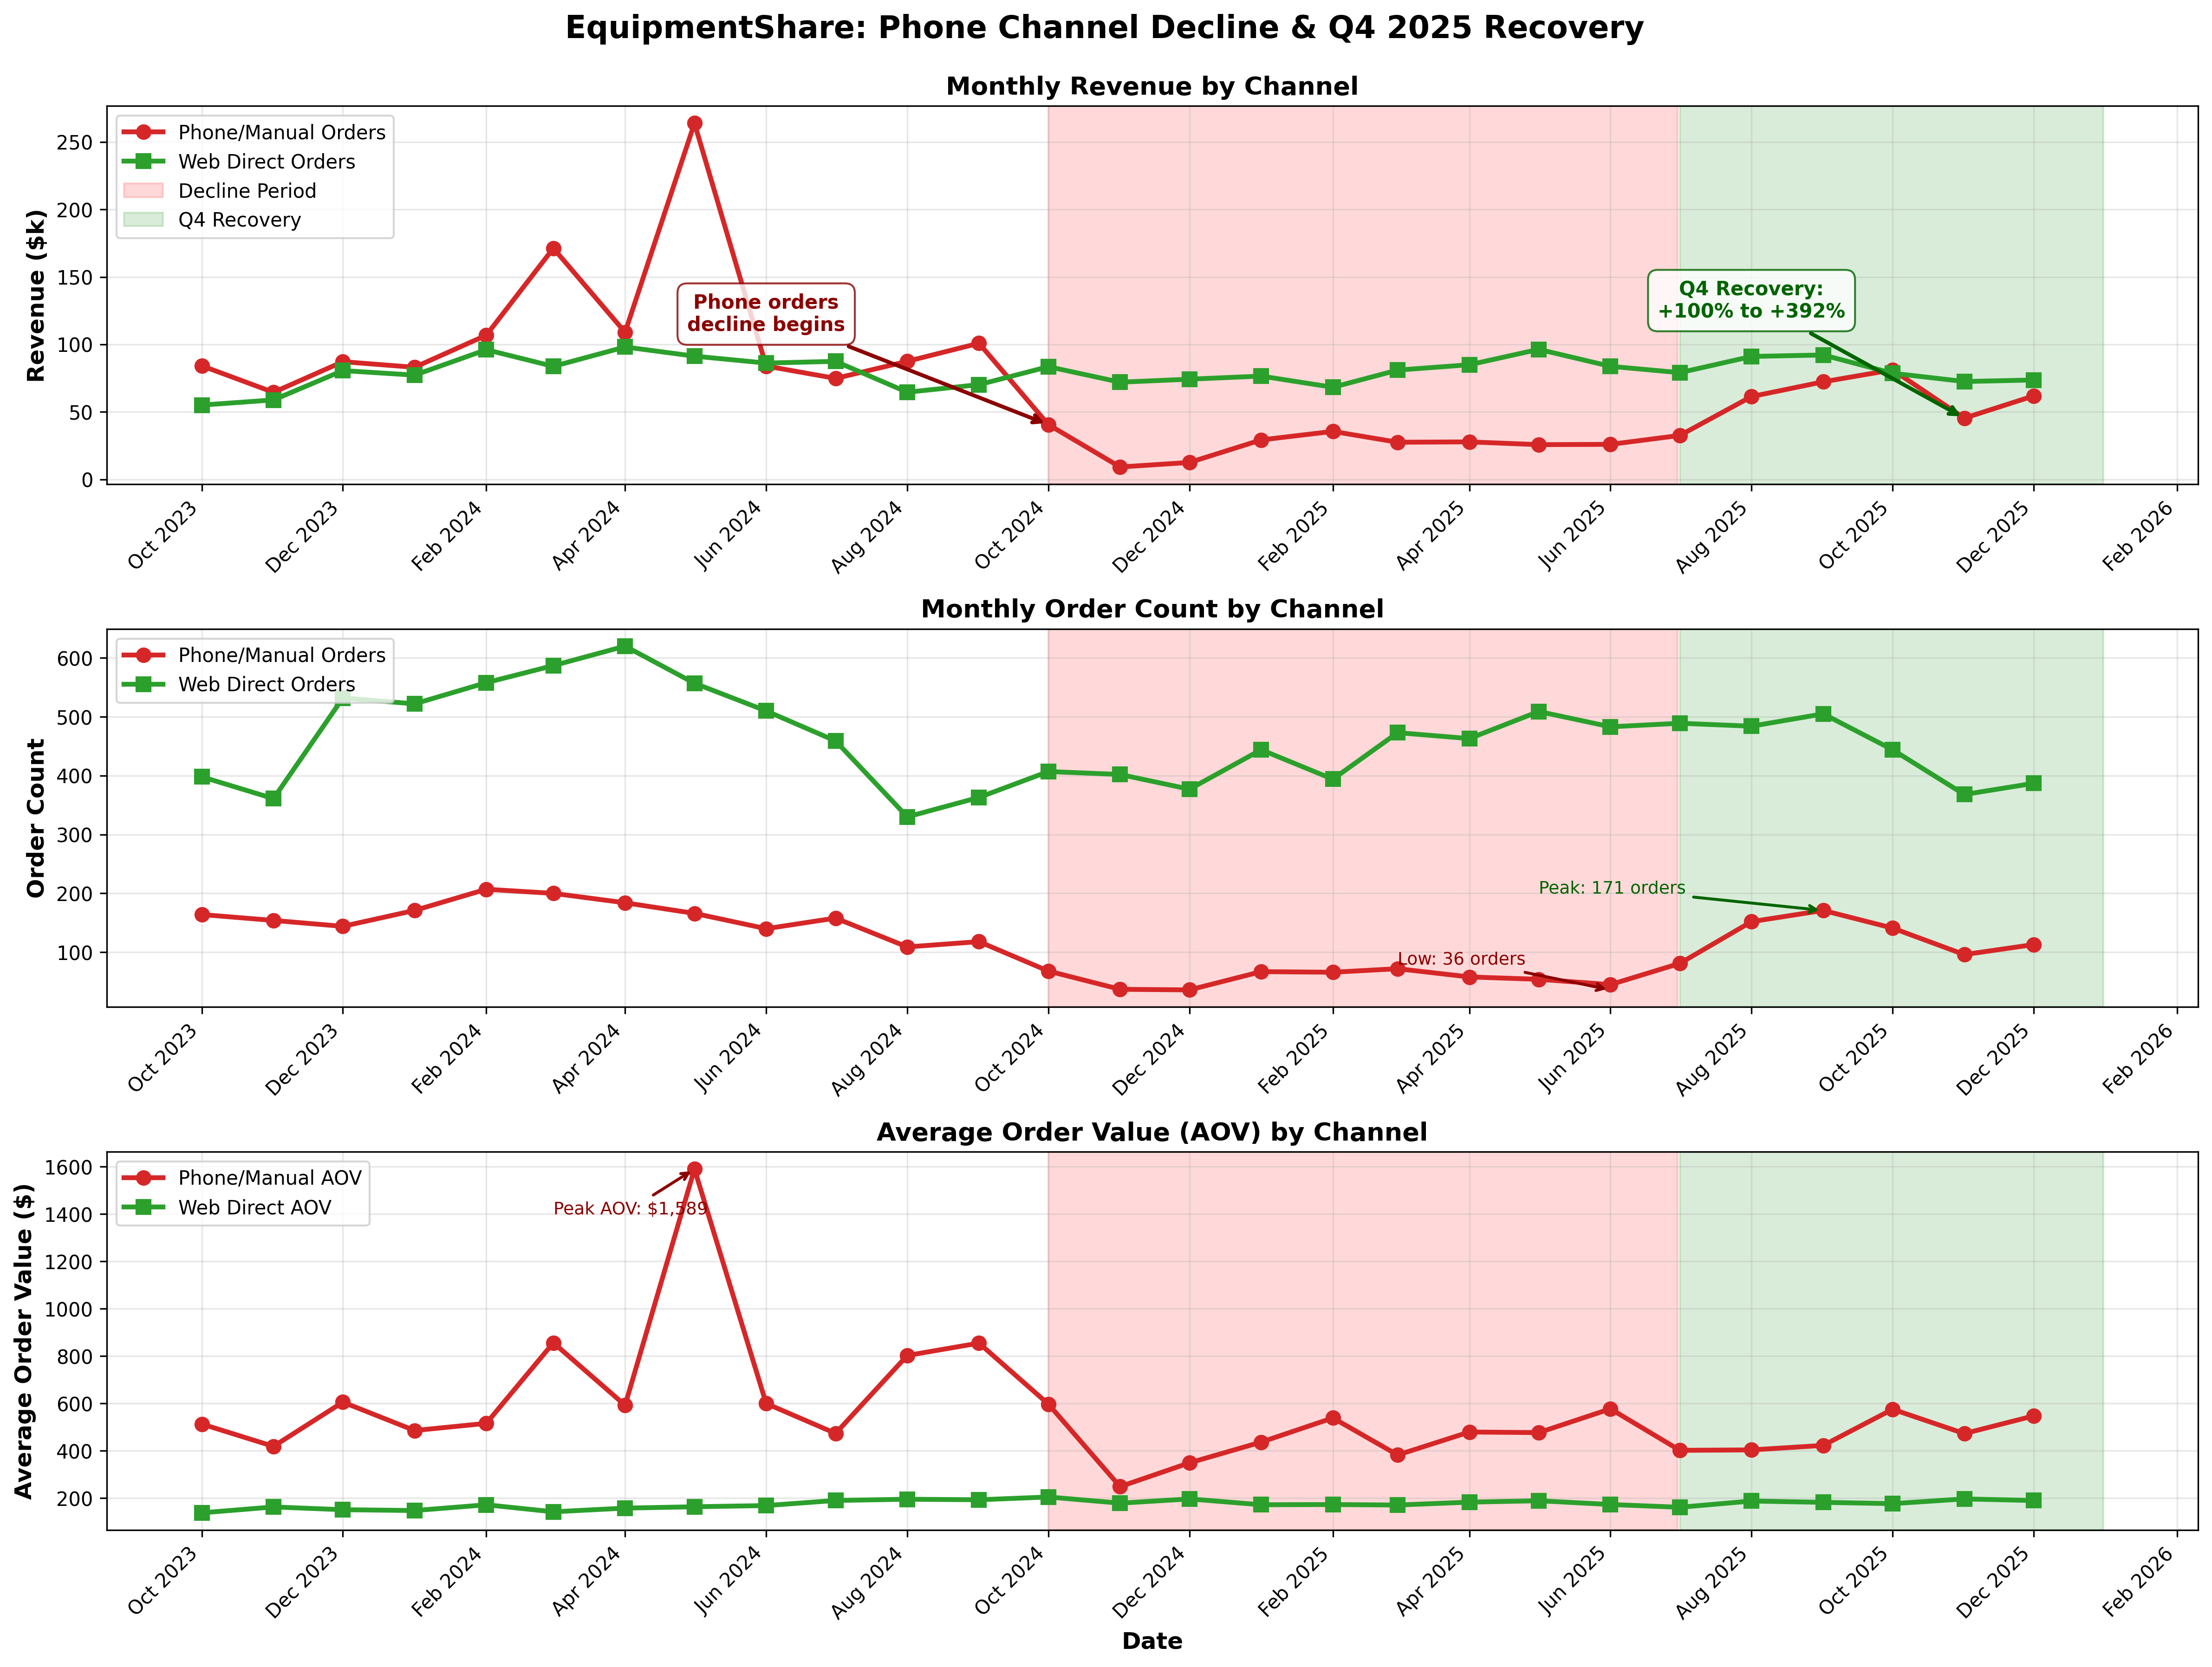
the phone-channel orders (the shopify:es_manual tag class) had
cratered. That's the order-desk taking orders by phone, normally a high-AOV channel.
Its collapse aligned exactly with the AOV decline.
Step 4 — track the Q4 2025 recovery
Once the phone-channel decline was identified, the question turned into "is it coming back?" We extended the same toolkit forward, month by month, through 2025. Q4 turned out to be the headline:
| Month | Orders YoY | Revenue YoY |
|---|---|---|
| Oct 2025 | +107% | +100% |
| Nov 2025 | +160% | +393% |
| Dec 2025 | +214% | +392% |
Step 5 — validate the Jan 8 Shopify theme change
On Jan 8, 2026, EquipmentShare deployed a new Shopify theme. Within a few weeks, the question came back: did the new theme hurt anything?
We extended the comparison to the period Jan 8–28, 2026 and split by channel. The honest answer was mixed:
Phone continued accelerating — the theme change didn't hurt it. But web direct orders were materially down YoY. That's a signal worth investigating before any further theme work lands, though we couldn't isolate "theme change" from other factors (ad spend shifts, seasonality, the broader phone-channel recovery pulling demand to phone) in the three-week window we had.
What's durable after the engagement
Three artifacts continue to be useful regardless of whether Tromml is in the room:
- Internal/external order classification is baked into the DataMonster
Shopify staging model. Any future report that filters on
_tag_list NOT LIKE '%es_internal%'orNOT LIKE '%es_manual%'gets the right answer automatically. New operational tags can be added in one place. - The comparison toolkit (
ad_hoc/equipmentshare/2025_diff/) can be re-run any time. Change--yearsor--monthsarguments; same output format, same filtering. The methodology doc explains when to use MoM vs TTM. - The phone-recovery visualization script (
visualize_phone_recovery_2025.py) regenerates the chart with whatever date range you give it. It's the canonical "phone vs web" view for board-level reporting.
Open questions worth tracking
- Re-run the Jan 8 theme-change comparison at the 90-day mark (around Apr 8, 2026) and 180-day mark to confirm or refute the web-direct decline.
- Phone-channel AOV is sitting at $1,204 against a ~$500 historical baseline. Is that a sustainable mix or pent-up demand from the recovery period? Worth a check at the 6-month mark.
- The internal/external rules ship with a fixed list of tag patterns. Anything new the order desk adds (new branch codes, new phone-entry conventions) will silently reclassify as external until the rules are updated. Worth a quarterly audit.