The question
Once the diagnostic work (case study 1) was running smoothly, the engagement shifted toward a different shape of problem: "this analysis is useful — can it just keep running?"
Each of the four workstreams in this case study followed roughly the same arc. Someone at EquipmentShare asks a specific question. We do a one-shot to answer it. The answer is useful enough that the next question is "can we do this again in three months without you?" We then take the one-shot and turn it into something that can recur — a fact table, a parameterized script, a documented checklist, or in the most recent case, a Claude skill that wraps the whole pipeline behind a single command.
Orders by Shopify reporting location — BigQuery fact
Where did this order ship from?
EquipmentShare fulfills from multiple Shopify locations (branches, warehouses). Existing reporting collapsed all fulfillment into a single revenue number — useful for the company total, useless for asking "how is the Denver branch doing?" or "is Branch X out of stock again?"
We built a three-model pipeline in DataMonster that materializes order lines × location as a BigQuery-ready table:
stg__shopify__location— staging from the raw Shopify locations JSONB feed, dedupes bylocation_id, picks latest byupdated_at. Strongly-typed address, country, active/legacy flags.stg__shopify__order_item_fulfillment_location__lookup— joins line-item fulfillments to locations onfulfillment_location_id, scoped tofulfillment_status = 'success'.export__bigquery__report__order_lines_by_location— final materialized table joining in the client app'sstore_name. This is the table BigQuery dashboards point at.
datamonster/datamonster_dbt/models/shopify/ and
models/dashboard/. Materialized as a table, exported to BigQuery on the
standard DataMonster cadence. Refreshes whenever the upstream Shopify pipeline runs;
no human intervention.
80/20 SKU competitive intelligence
Who's competing with us on the SKUs that actually matter?
Direct competitive intelligence for ~7,000 SKUs is infeasible to do manually. But EquipmentShare's revenue isn't evenly distributed — a small fraction of SKUs drive most of it. We took the standard Pareto cut:
For each of those 498 SKUs, the tool runs a Google Custom Search for
{brand} {mpn}, hands the search results to Gemini 2.5 Flash, and
extracts structured competitor data: retailer name, seller, price, availability,
shipping. Two layers of caching (search + LLM) make subsequent runs cheap. The
runner is parallelized — 10 workers, 50-SKU batches — and saves per-SKU JSON
progressively so a crash doesn't lose the work.
The whitespace analyzer (Phase 3) then categorizes the SKUs by competition level and pricing position, generates per-brand battlecards, and flags monopoly-position SKUs vs contested ones.
ad_hoc/equipmentshare/ecommerce_competitive_analysis/
— full Python toolkit with quarterly run checklist (QUARTERLY_RUN_CHECKLIST.md),
config-driven (Google API quotas, LLM model, parallelism), validated end-to-end tests.
Cost per quarterly run: ~$0 on free tiers, ~$0.50 with paid LLM fallback. The
consolidated competitor profiles, battlecards, and HTML dashboards live in the
dated output folders.
Walmart channel evaluation — the "we said no" workstream
Should EquipmentShare invest more in Walmart marketplace?
Walmart had been live for 4.5 months when this came up. The question wasn't "is it working?" — it was "is it worth pushing harder?" We pulled 24 months of order data across all three external channels and ran a structured comparison.
| Metric | Walmart | Amazon | eBay |
|---|---|---|---|
| Total orders (24mo) | 110 | 3,236 | 6,661 |
| Total revenue | $9,551 | $539K | $931K |
| Average order value | $87 | $167 | $140 |
| Refund rate | 2.73% | 8.18% | 4.17% |
| Months active | 4.5 | 24 | 24 |
Walmart had genuinely good signals: best refund rate of all channels (product-market fit seems fine), and a faster initial ramp than Amazon or eBay had at the same age (96 orders in the first 16 weeks vs Amazon's 35 and eBay's 66). The case to push harder was not nothing.
But the case against was structural. Walmart's marketplace customer base is 95% consumer-focused (home, beauty, electronics, pets). Industrial/agricultural parts aren't a Walmart growth category in any of their 2025 investor communications. AOV at $87 is half of Amazon's $167 and declining. Walmart Business (the B2B side) is invitation-only and dwarfed by Amazon Business.
The deliverables are written to be re-readable — the executive summary stands alone for leadership, and the strategic context document includes the Walmart marketplace history and outlook context that informed the recommendation.
ad_hoc/equipmentshare/walmart_analysis/
— 5 markdown reports (also as PDFs), 7 PNG visualizations, monthly trends CSV,
top-selling-SKUs CSV. Re-runnable with the Python scripts when you want updated
numbers.
Inventory × sales pipeline — and a Claude skill that runs it
"Don't restock stuff that's not selling" — but how do we know it wasn't selling because it was out of stock?
EquipmentShare's purchasing team didn't want to pay to restock SKUs that hadn't sold recently. Reasonable rule. But the client suspected — correctly, it turned out — that a meaningful chunk of their "declining" SKUs had actually stocked out, not lost demand. A SKU can't sell if it isn't on the shelf.
This is the workstream that became the most productized piece of the engagement. We built an end-to-end pipeline that joins weekly Shopify Matrixify inventory snapshots with multi-channel weekly sales into a single (SKU × week) panel, then classifies each SKU into one of four behavioral patterns:
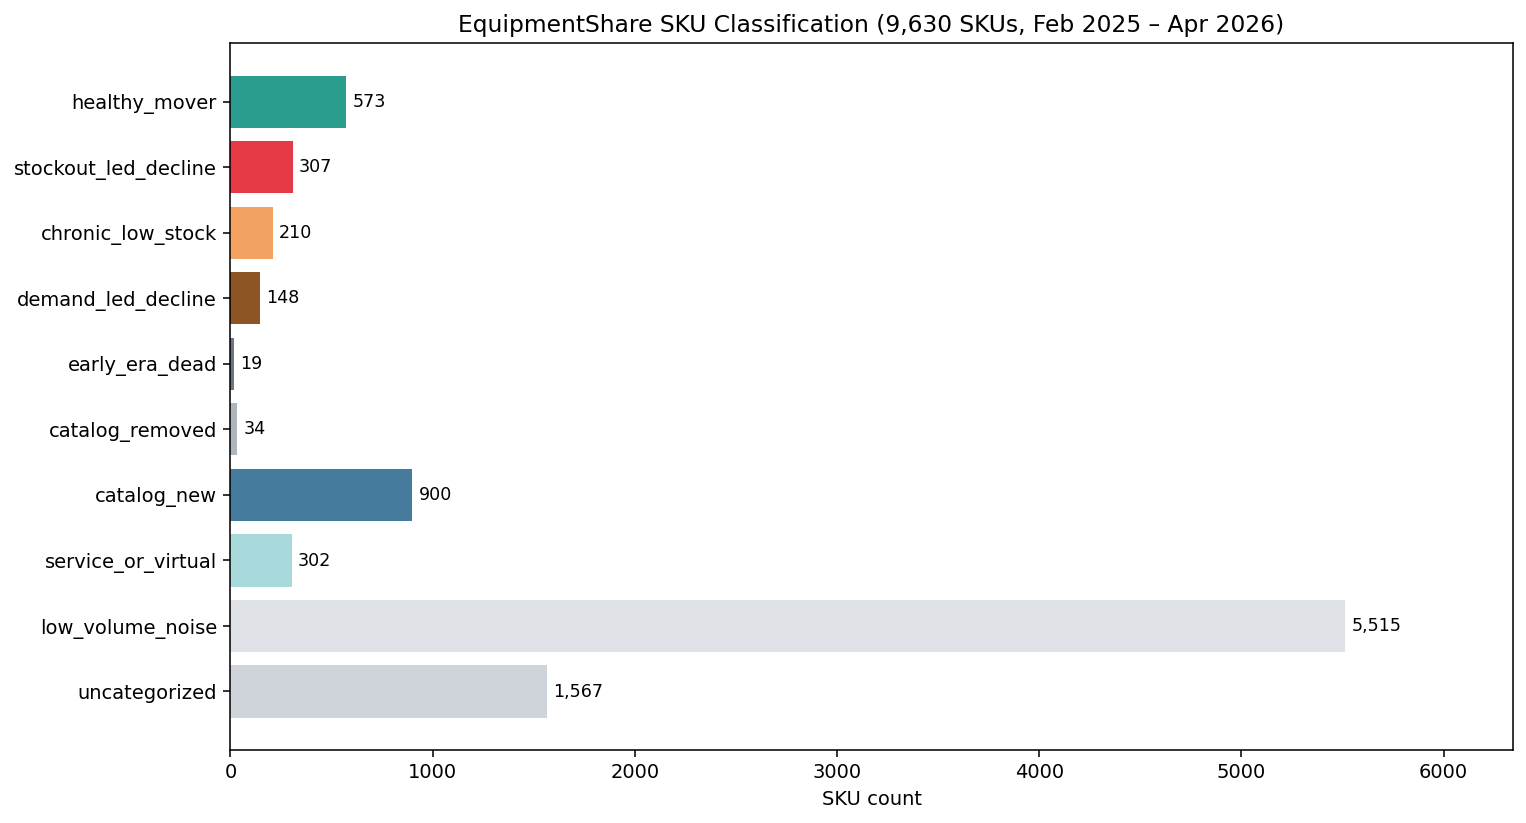
For stock-out-led decline SKUs, the pipeline computes a lower-bound lost-revenue estimate using the pre-stockout run rate. For healthy movers, it computes a target stock level using a standard reorder-point formula:
- Lead time: 4 weeks (1 month) by default, overridable per MPN via
config/lead_time_overrides.csv - Service level: 95% (z = 1.65)
- Review period: 2 weeks (how often purchasing reviews stock)
- Demand distribution: trailing 26 weeks, excluding weeks where inventory was zero (since those understate demand)
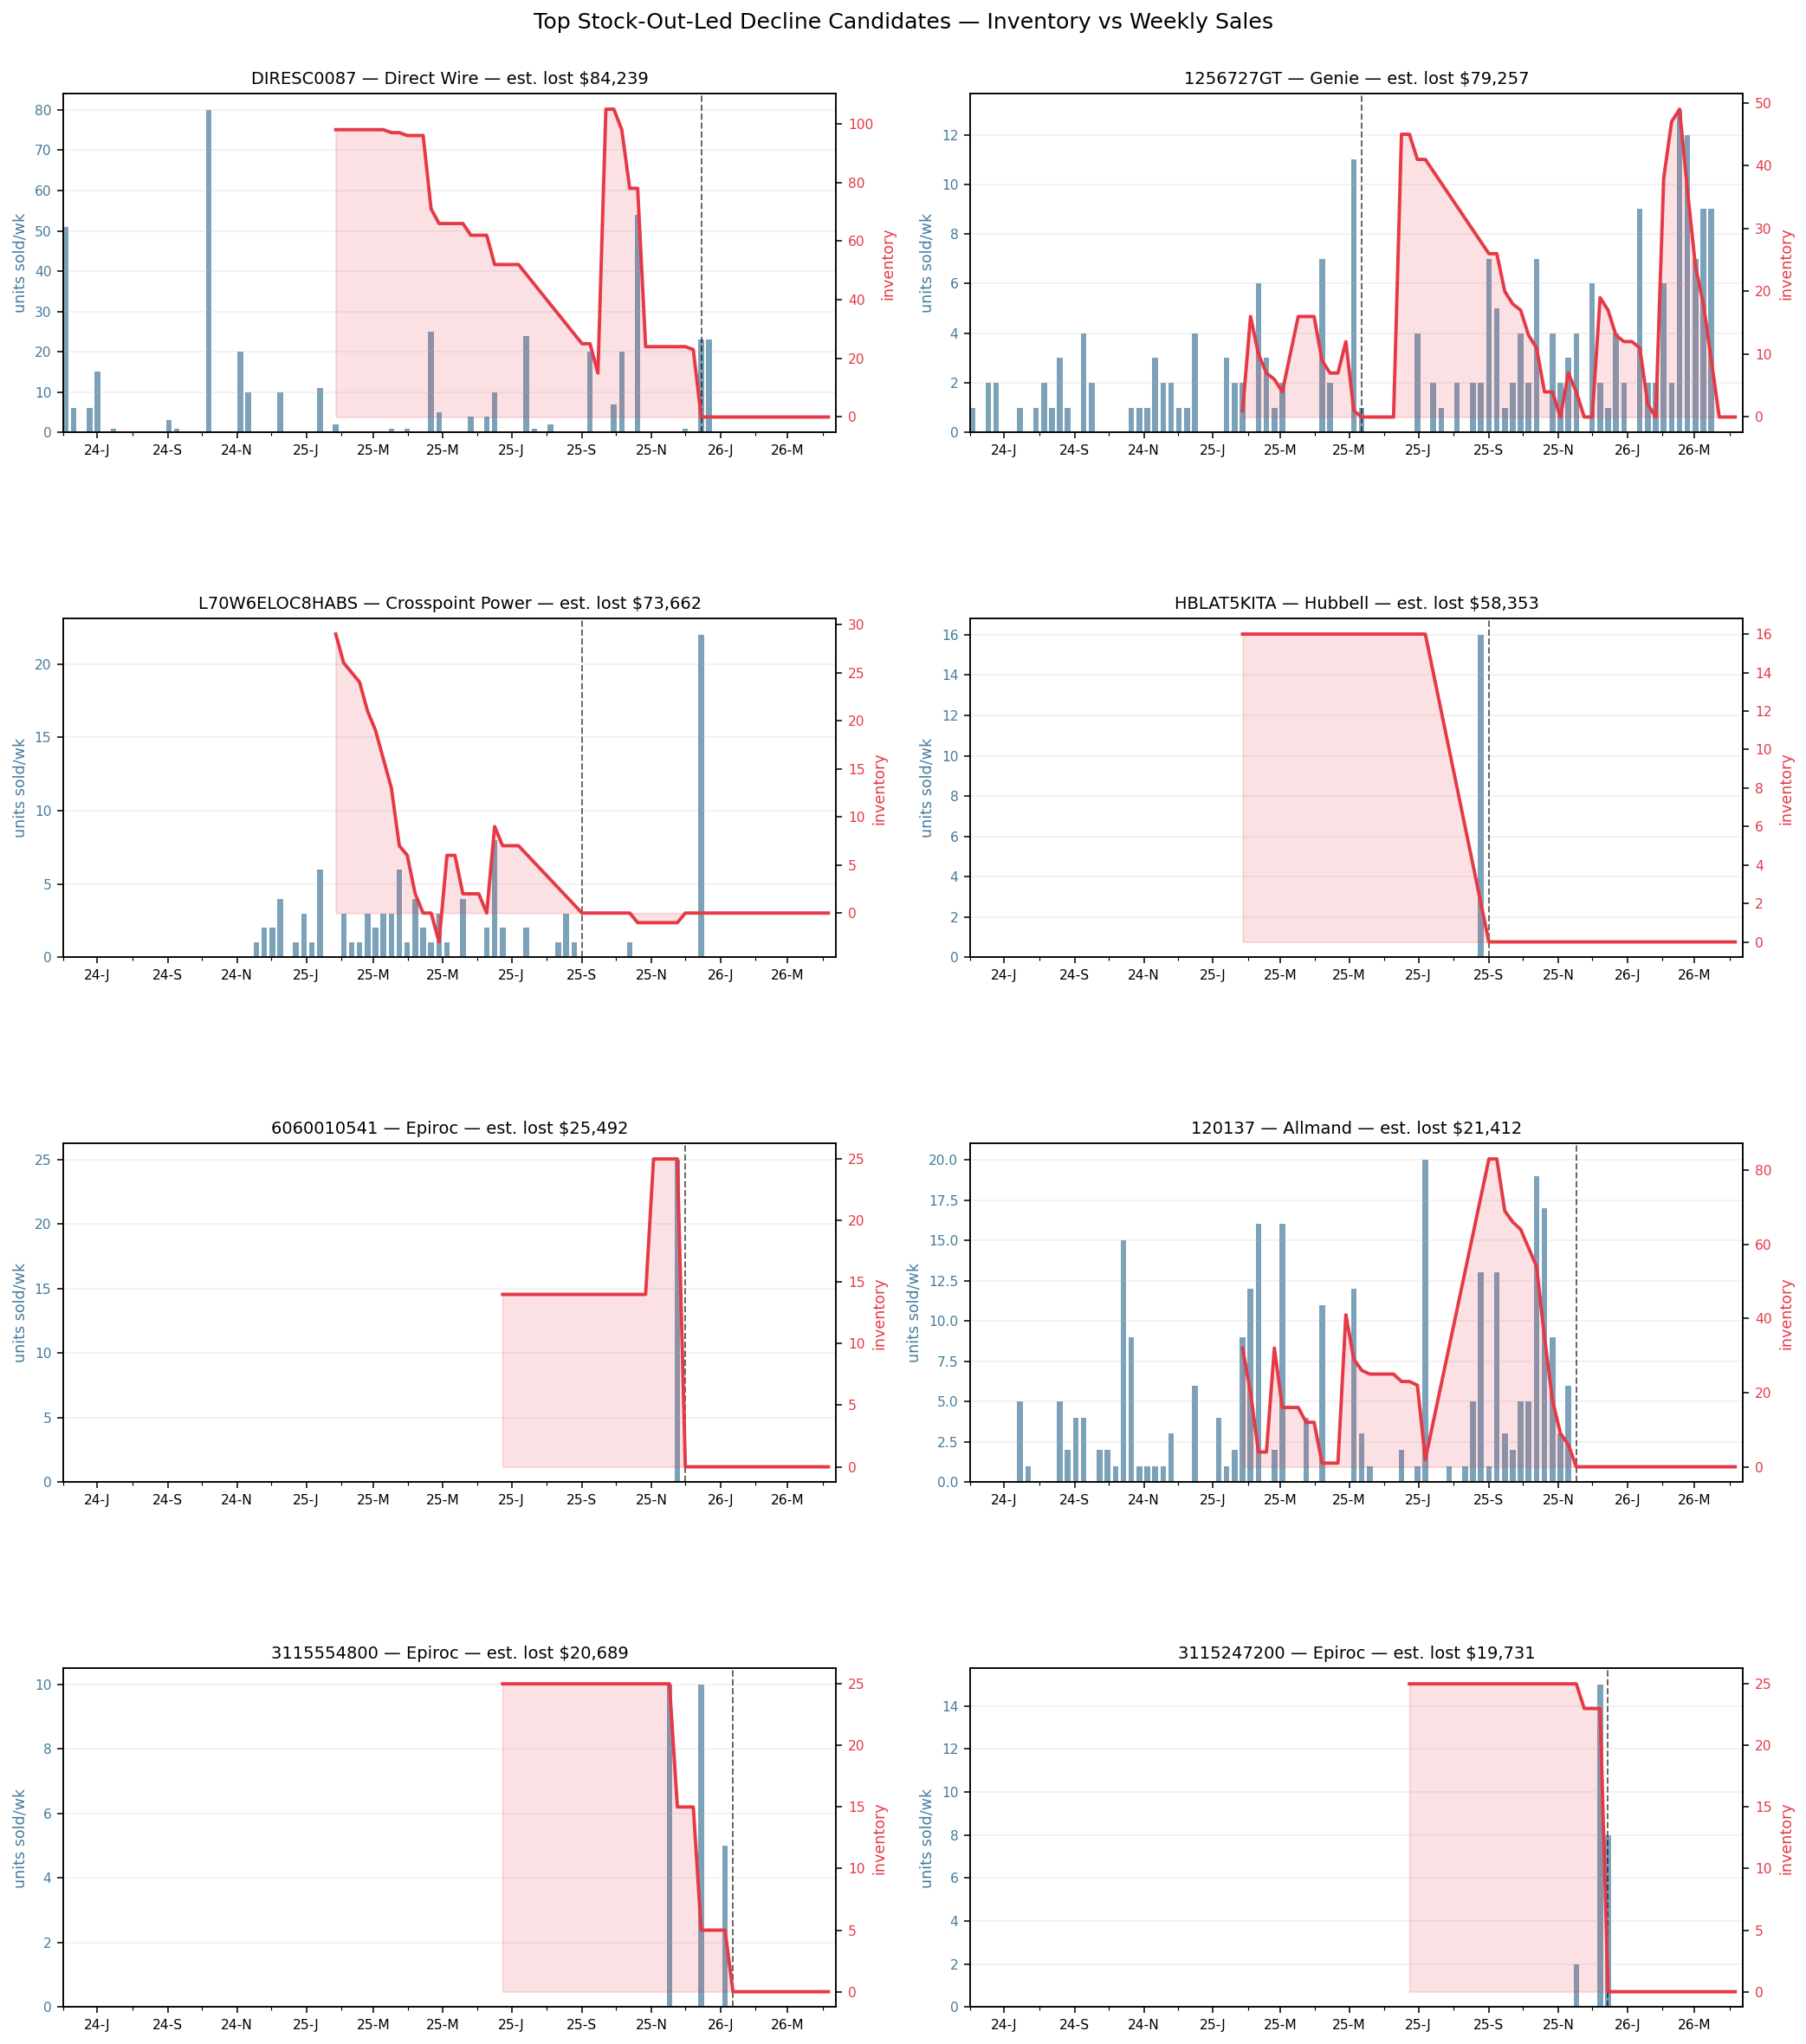
ad_hoc/equipmentshare/2026_Apr_inventory/
— SQL extracts, Python pipeline (5 stages), run_pipeline.sh orchestration,
DEFINITIONS.md methodology doc, and the reusable Claude skill. First
dated output: 2026-04-09 (stocking-level recommendations, pattern summary, pattern
distribution and top-restock charts).
Data caveats we surfaced (and documented)
Two data-quality gotchas worth knowing about because they affect the inventory analysis specifically — and any future work that touches the Matrixify feed:
What's durable after the engagement
- The order-lines-by-location BigQuery fact table refreshes on the regular DataMonster cadence with no intervention. Branch-level reporting is a query away.
- The competitive intelligence toolkit can be re-run quarterly using
QUARTERLY_RUN_CHECKLIST.md. ~$0 marginal cost on the free LLM tier. - The Walmart analysis documents are written to be re-read by future EquipmentShare leadership without us in the room. Re-evaluation in June 2026 will use the same scripts against fresh data.
- The inventory pipeline + Claude skill is the most reusable piece. Quarterly refresh is a single conversation; the skill encodes the data caveats and methodology so it doesn't drift.
Open questions worth tracking
- Stocking-level recommendations are draft thresholds. The pattern classification rules (≥4 consecutive weeks of zero inventory, ≥50% sales drop, etc.) were chosen for the first run and haven't been validated against actual purchasing decisions yet. Worth a tuning pass after one quarter of use.
- The competitive intelligence tool surfaces competitors but doesn't price-monitor over time. Pricing position drifts. A scheduled monthly run would catch this; we left it as quarterly because the LLM-API cost grows linearly with frequency.
- Internal/external order rules ship with a fixed list of tag patterns.
If the order desk introduces new operational tags (new branch codes, new entry
conventions), they'll silently reclassify as external until the rules in
stg__shopify__order_item.sqlare updated. Quarterly audit recommended. - Walmart re-evaluation in June 2026. Hit-or-miss against the 6-month targets (50+ orders/month, $100+ AOV) is the decision point for whether to sunset or invest.